This is the second part in our series on Tableau. In our introduction to Tableau, we explained how to use Tableau software to draw charts. For the data, we used a Microsoft Excel spreadsheet. But Excel is not a database, so you cannot perform operations like correlations because Excel doesn’t have indexes or other features common in databases.
Tableau’s answer to that? With the desktop version of Tableau, you can convert Excel files to Tableau format (a .hyper format file). That adds the extra attributes to your Excel data that are needed to make Excel function like a database.
But a better approach is to load Excel data into a database first, since a database is built for SQL operations and Excel is not. We illustrate this approach here by loading Excel data into PostgreSQL.
Prerequisites for PostgreSQL in Tableau
We’ll use PostgreSQL for this example because it’s open source. Other data warehouse-type databases can be expensive, so PostgreSQL is a good place to start.
Before we show how to use PostgreSQL with Tableau, some setup is necessary. First, we need to put some data into Excel and then expose PostgreSQL to the public internet so that Tableau Cloud can access it. Follow these steps:
- Enable Remote Access to PostgreSQL.
- Put listen_addresses = ‘*’ into /etc/postgresql/9.5/main/postgresql.conf
- Put host all all all password into /etc/postgresql/9.5/main/pg_hba.conf)
- Open the firewall port to allow inbound connections on port: 5432.
- Create a database using the psql shell.
- Create a user and give them access to that database.
- Load some data into a table.
- If you can, use a credit or bank statement so you can have similar financial information as we are using below. We need each transaction assigned to a category.
- Download your bank statement as a .csv file and then upload it to PostgreSQL using the COPY command.
Note: We will use this same data in additional articles in this series.
Second, you’ll want access to the cloud version of Tableau. Tableau offers a free 14-day trial. Use these tutorials to practice before purchasing.
Create a workbook in Tableau
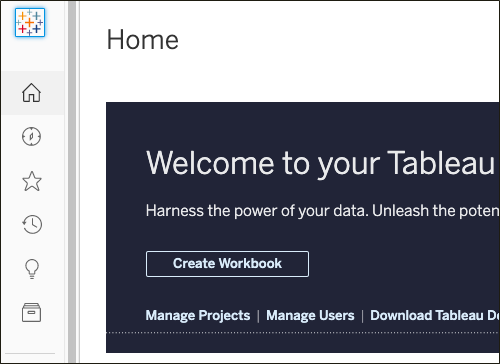
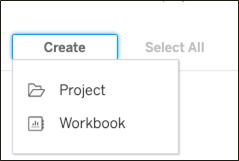
Login to online.tableau.com then click Create Workbook.
Add a data source
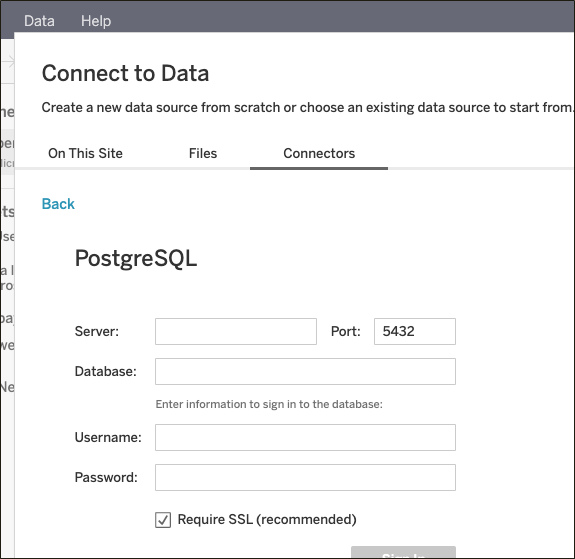
Add a data source. If you are unable to connect, then you have not properly exposed PostgreSQL to the public internet.
Note: You need to put some security on this as hackers will start running port scan. At a minimum, put a password and change the Postgres user’s password. It would be difficult to limit the IP address that can scan your server to the PostgreSQL cloud, unless you figure out what that is.
Fill in the bottom and turn off SSL, unless you have an SSL certificate.
Put the name of the database that you created when you imported your bank statement (or other data).
Click update to refresh the columns with data
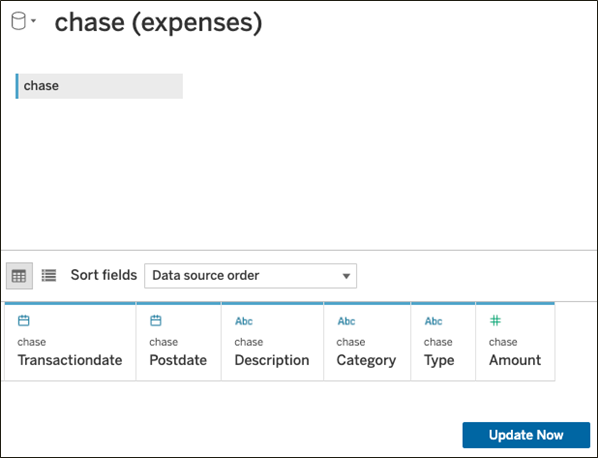
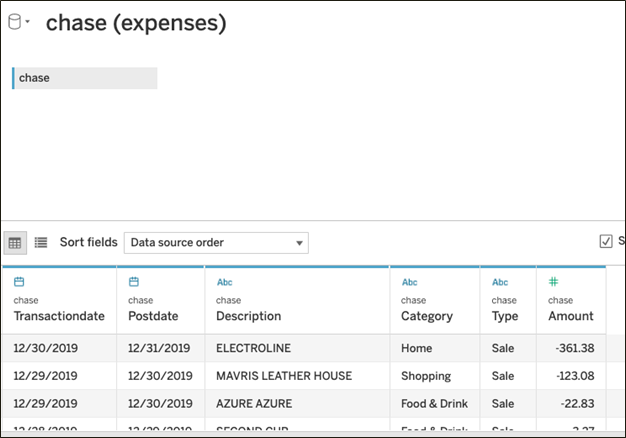
Data should populate now:
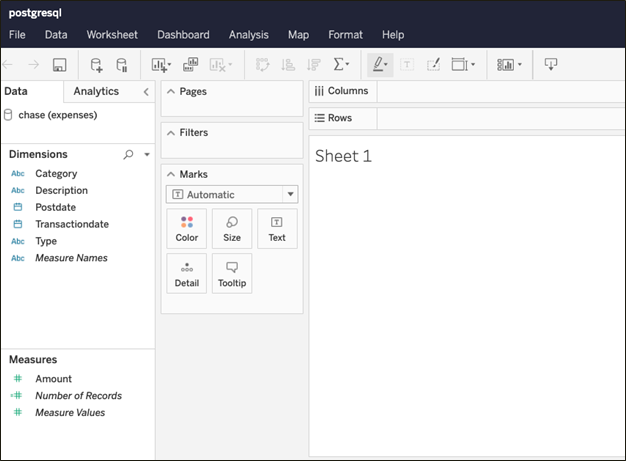
Save your work as a workbook so that the worksheet (chart) editor will open:
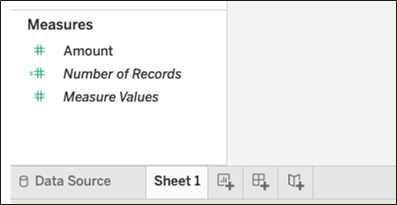
To get back to the worksheet, notice the tabs at the bottom:
Create a function
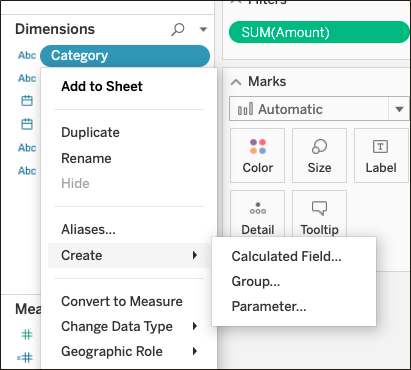
Let’s create a function, which Tableau calls a Calculated Field. Click a field then click Create Calculated Field on the fields lists in the Dimensions panel.
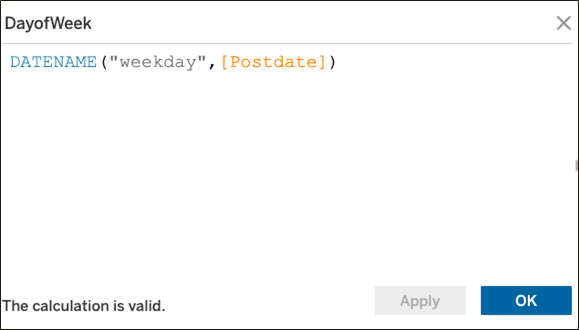
When you type the first few letters, Tableau suggests function and field names. Put field names in brackets [] then assign some descriptive name at the top. Tableau will add that field to the dimensions panel so that you can chart it.
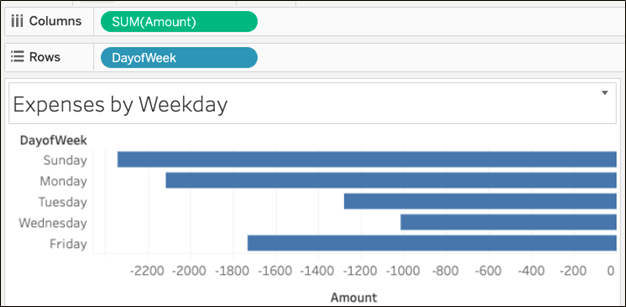
Here is the resulting chart:
