IT Organization Metrics & KPIs: A Well-Rounded Approach

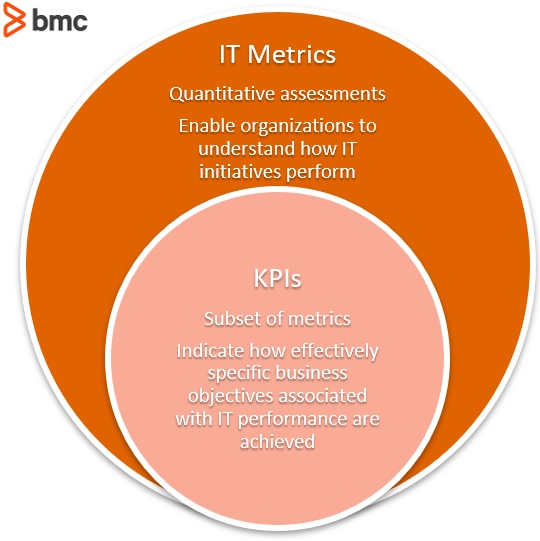
We’re previously looked at metrics and KPIs for IT Service Management (ITSM). You may well be wondering just how these metrics differ from those for the IT organization—and that’s a very good question.
Our ITSM metrics look at the efficiency of critical service management processes. The success of the IT organization, however, will depend on a far broader set of metrics and KPIs. Four key areas determine how well an IT organization is performing:
In each of these areas, any number of key metrics will give you a clear picture of how well the IT organization is performing. Let’s take a look.
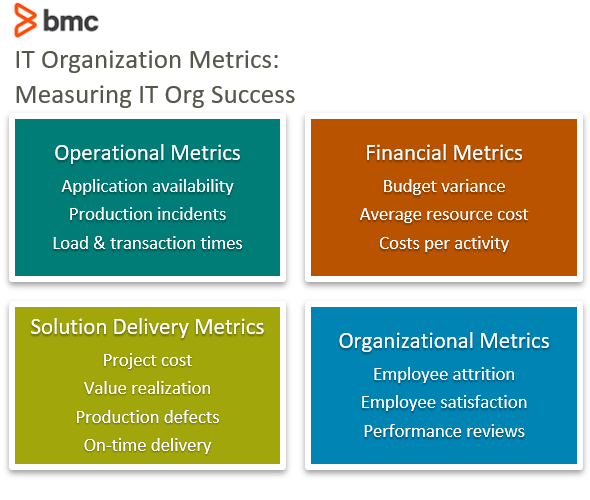
Operational metrics measure how well your production systems are performing. Here are metrics to consider:
This metric looks at the percentage of expected time that an application is functioning within acceptable parameters. Availability can be a difficult metric to define:
To ensure that the measurements you are taking give a true representation of availability, break the application down into primary and secondary functions—if all primary functions are working as expected, the application should be considered available. Likewise, consider the critical users of the application: If all these groups can access it and work successfully, then the application is available.
If an application is normally not used afterhours, then an outage at this time should not be factored into availability metrics. You may still wish to record downtime outside of these parameters, but just report on the times, locations, and user groups that matter to the business.
This metric will record the number of incidents per application, grouped by severity. Reporting to the business on production incidents should concentrate on times and user groups that have an impact on business productivity.
An application being available is not always enough to satisfy business users. Major causes of frustration are slow load times and extended transaction times. Measuring and reporting on these critical times will give a more nuanced picture of how well applications are performing.
Financial metrics are used to show how well you’re managing the cost of service delivery.
(Learn more about IT finances in our IT Cost Management Guide.)
Are you working within your budget? Do your actual costs line up with your budgeted costs? This measurement must include direct and indirect expenses.
We know not to overspend. Overspending will have an impact on the profitability of the wider organization. But underspending can be problematic too. Spending less than forecast may mean that you are underinvesting in your IT organization.
This metric looks at the average cost of technology resources. This will show how well costs are being controlled by using lower cost resources where appropriate. This can also indicate how well balanced the technology workforce is:
Keeping track of the average resource cost, rather than setting limits on different types of resources, gives flexibility and allows IT leaders to use best judgement in the appropriate makeup of their technology resourcing.
Measuring costs in different parts of the organization can highlight whether you have the right balance or show exactly where you need to make improvements:
If your business wants to be at the cutting edge of its industry, you should expect to spend more money on innovation and less on keeping the lights on.
These all-new for 2020 ITIL e-books highlight important elements of ITIL 4 best practices. Quickly understand key changes and actionable concepts, written by ITIL 4 contributors.
Solution delivery metrics measure how successfully you’re delivering new functionality to the business.
Project cost is a relatively straightforward metric.
A project that comes in well under budget can be as much of an issue as one that exceeds it, as funds that have been allocated to the project cannot be spent elsewhere until the project has been completed. If project costings are consistently over or underestimated, you’ll need to focus time and resources on improving this aspect of solution delivery.
Did the solution you delivered to the customer provide the expected business benefit? A good business case will clearly articulate the business value that is expected to be delivered by the new or changed solution. This value should have been expressed in a way that can be measured. If possible, perform pre-delivery benchmarking to fully understand the value delivered by the new solution.
Post-delivery, you need to create a picture of the new or improved business value that has been created. This value may be measured in several different areas, these are a few that you could consider:
If the projected business value has not been achieved, you will need to understand why and look at ways to close the gap between expected and realized value.
Defects that escape the test environment into production cost a lot more to remove, both in terms of money and productivity. Removing these defects during the development phase is critical. Measuring defect identification and removal will give a good picture of the effectiveness of your testing practices.
One metric that can be applied to this is to look at the number of defects identified and corrected during development and compare this to the number discovered during the first 30 days of production.
Another important metric for solution delivery is the percentage of projects that are delivered on time. This metric is more useful for projects delivered via a waterfall methodology. When solutions are delivered using an agile methodology this metric is generally not relevant.
Organizational metrics might try to measure any number of things but most of these come down to just one item: how engaged is your workforce? Here are some ways to do that.
This metric looks at the number of staff who voluntarily leave the organization. Costs involved with retaining staff will almost always be less that those involved with training new team members.
If the number of staff who choose to leave is increasing, this is a good indication that there is a problem in your culture that needs to be resolved.
Just as we measure customer satisfaction, it is important to understand how your staff feel about working in the organization. An unhappy culture will have a severely negative impact on productivity. Surveying staff regularly, on a strictly anonymous basis, will pinpoint areas of concern and provide valuable data to direct efforts aimed at improving organizational culture.
A good performance review system, one that concentrates on growing employee skills and value, will help build a productive and balanced workforce. These periodic reviews give a snapshot of staff performance, but they should not be the only way we measure how well staff are functioning.
Encouraging regular one-on-one sessions between managers and their team members will mean that formal performance reviews do not present unwelcome surprises. Effective leadership practices will allow you to constantly measure the sentiment and performance of your staff.
(Get more leadership strategies in our IT Leadership & Best Practice Guide.)
The measure I have suggested here are not exhaustive, but they provide a good starting point for measuring the effectiveness of your IT organization. Not all these metrics will be suitable for every organization.
As with all metrics and KPIs, select those that are meaningful for your own business. Once you do that, make sure you are prepared to act on the results you uncover. Metrics reports are meaningless if you are not prepared to use the information to improve your organization.
For more on business culture and IT development to support business value, explore these articles:
