Use Cases for Graph Databases
When you start reading about graph databases, your first impression might be this is a product that is clever but it still looking for uses cases, like the early days of the IoT (Internet of Things). This is because it is so esoteric that regular RDBMS and even noSQL architects, CIOs, and programmers are going to have some difficulty wrapping their head around it.
First, despite its strange appearance, the graph database is more flexible than a regular relationship database because you can show the relationship between item with simple arrows, which is a natural way to do that. The most famous example of that is the Facebook model. The arrows shows who are friends and who likes what. To do that in a relational model would require doing expensive joins. Plus you would have to extend the schema to include additional fields to represent properties of each entity and make lots of arrays. While you can do that easily with most noSQL databases, you can also do that with a graph database, but with added benefit of the multidimensional graph.
in short, if you were to take all the data in some model and draw arrows showing what items relates to another and how, it would become a very dense picture that you cannot easily see or even grasp in you mind if the data is large.
A graph database has algorithms that makes sorting through all of that easier. The most notorious example of this is analysts dumped financial data into a graph database and by happenstance uncovered the infamous Panama Papers scandal, where criminals, movie stars, and even the Queen of England were found to be hiding assets in offshore bank accounts.
The top use cases are simple to explain. It's the cases beyond that where you might find yourself something of a pioneer, without a lot of technical details of how other companies have implemented one of these.
The most common use case are:
Fraud detection at banks and even login mechanisms, like Facebook, seem to work rather well. They send you a notice when there is suspicious activity on your account and then decline your, for example, credit card. Then you would have to contact your bank and confirm that you are really in, say, Kathmandu and this is you trying to make an online purchase and not a hacker. It does this using different algorithms designed to crawl the nodes and edges of a graph model to flag suspicious activity.
In other words it can look at thousands or millions of nodes like shown below to put your transaction into a risk bucket and flag those deemed high risk:
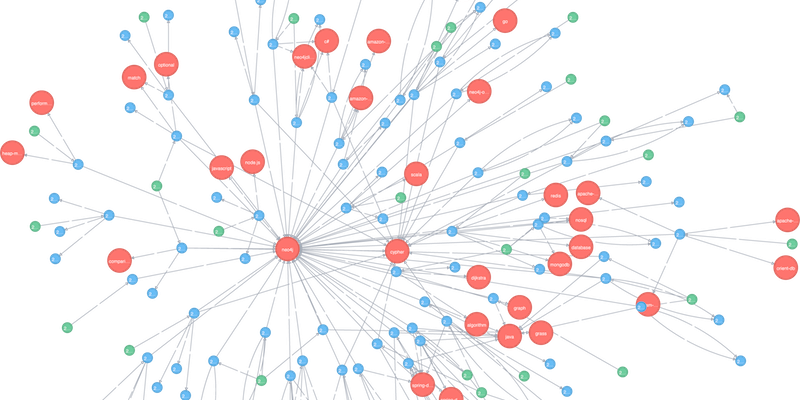 Graphic source: NEO4J
The fraud analysis use case could be applied to cybersecurity intrusion detection as well. It has the benefit of sending analysts to look at only events that are truly significant and not wasting resources on outlier events that are statistical flukes, because it uses intelligence and not hard-coded thresholds.
When you shop on Amazon or watch series on Netflix, those platforms search through your viewing and purchasing history, and people deemed to be similar to you, to recommend items you might want to view or purchase next. Netflix looks at IMDB. Amazon looks at what people who have purchased the item you just bought. For example, if you buy an iPhone then it might suggest an iPhone cover.
This is a use case mentioned by Neo4J, DataStax, and other vendors. It is often referred to as a way to manage "data silos." It's similar to the Identity Management use case, as it keeps track of what data you have on who and which database stores it. So this is metadata. The actual data would be stored in SQL or LDAP (for Identity Management)—that is, not a graph database.
As with an IDM system, the complexity with this type of system would be the need to keep the metadata accurate. I have worked with several IDM products and can tell you that there are often problems updating the central IDM repository as user credentials and permissions are synched from one system to another.
One cited used case is the ability to comply with GDPR and other privacy requirements, as it lets a company show what data they have on which people.
This is a natural use case because a network topology looks like a graph. So, it makes sense to model it that way.
Here are some other use cases proposed by DataStax and others: