What is the ELK Stack?

A stack is any collection of software products that are designed to work together, such as the popular LAMP stack, comprised of Linux, Apache, MySQL, and PHP. The ELK stack includes ElasticSearch, LogStash, and Kibana.
ELK is one of the most widely used stacks for processing log files and storing them as JSON documents. It is extremely configurable, versable, and scalable. It can be simple to use or complex, as it supports both simple and advanced operations.
ELK is best understood by looking at the pieces in the following diagram.
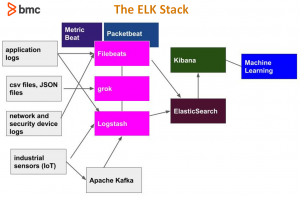 Going left to right and top to bottom we have the following components:
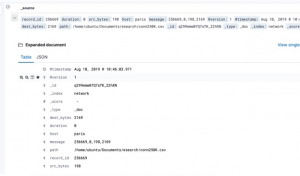
Each ElasticSearch document is stored under an index and document type, which is given in the URL. For example, the document below is index/type /network/_doc. Each document requires a unique identifier which is the _id field.
Below is a sample web server log JSON document.
"_index" : "network",
        "_type" : "_doc",
        "_id" : "dmx9emwB7Q7sfK_2g0Zo",
        "_score" : 1.0,
        "_source" : {
          "record_id" : "72552",
          "duration" : "0",
          "src_bytes" : "297",
          "host" : "paris",
          "message" : "72552,0,297,9317",
          "@version" : "1",
          "@timestamp" : "2019-08-10T07:45:41.642Z",
          "dest_bytes" : "9317",
          "path" : "/home/ubuntu/Documents/esearch/conn250K.csv"
        }
ElasticSearch is a noSQL database, which means it does not require a schema. So, ElasticSearch will take a JSON document and automatically set up an index mapping.
Index mapping is advantageous, but sometimes you need to nudge it in the right direction because you may not always want an automatically created index map. With especially complicated nested JSON documents or documents with an array of other JSON documents, ElasticSearch might flatten fields that you want to set up and arrays. That could lead to misleading or incorrect query results. So, you can set this mapping up yourself, which we explain in several articles within this guide (see navigation on the right side).
Kibana lets you query documents using an easy-to-understand Lucene query language. This is opposed to using the more complex, more powerful DSL syntax written in JSON, which typically uses curl. For example, just type the word water in Kibana and any document that contains the word water will be listed.
The image below shows one document in Kibana.
You can query ElasticSearch using Kibana, by writing JSON queries, or by passing queries as command line arguments. The most common way to query ElasticSearch is to use curl. For example, here are some queries:
| List all indexes | curl -X GET 'http://localhost:9200/_cat/indices?v' |
| query by passing parameters | curl -X GET http://localhost:9200/samples/_search?q=school:Harvard |
| query by writing queries arguments as a JSON | curl -XGET --header 'Content-Type: application/json' http://localhost:9200/samples/_search -d '{
"query" : { "match" : { "school": "Harvard" } } }'
|
You write document using curl as well. Here, we are writing document _id = 1 index = samples and type = _doc.
To get an understanding of how to work with Filebeats and Logstash, here is a sample Logstash config file. This one parses a csv file and writes it to the ElasticSearch server at IP address and port paris:9200.
input {
  file {
    path => "/home/ubuntu/Documents/esearch/conn250K.csv"
    start_position => "beginning"
  }
}

filter {
      csv {
        columns =>
     }
    }

output {
  elasticsearch {
  hosts =>
  index => "network"
  }

 }