Here we will install ElasticSearch and Kibana using Ubuntu 16.04 and ElasticSearch 7.0.1. At the bottom are some troubleshooting notes.
ElasticSearch has become a public company now, having made an IPO and sold shares. One of its first actions was to create ElasticSearch version 7. Unfortunately the installation instructions for how to set up a cluster with version have changed. So we have written new instructions. The main difference from what we wrote below is there is no need to add any discovery plugins or configure those.
So these instructions replace the version 6 instructions we wrote here.
Server names
For this example we have two servers. Change the names and IP addresses to match your environment. Don’t use loopback address as we will make a cluster of two servers. Instead use their internal IP addresses.
172.31.46.15 parisx
172.31.47.43 paris2x
And we have this public IP address so we can access Kibana from the internet:
ec2-35-180-186-122.eu-west-3.compute.amazonaws.com:5601
Firewall Ports
Open firewall ports 9200 (http interface), 9300 (transport), and 5601 (KIbana.)
Install Software
Execute these instructions:
wget https://artifacts.elastic.co/downloads/elasticsearch/elasticsearch-7.0.1-amd64.deb
sudo dpkg -i elasticsearch-7.0.1-amd64.deb
https://artifacts.elastic.co/downloads/kibana/kibana-7.0.1-linux-x86_64.tar.gz
sudo dpkg -i kibana-7.0.1-amd64.deb
Create ElasticSearch Configuration File
On the paris server replace this file /etc/elasticsearch/elasticsearch.yml with:
cluster.name: paris
node.name: parisx
path.data: /var/lib/elasticsearch
path.logs: /var/log/elasticsearch
network.host: 172.31.46.15
discovery.seed_hosts: ["172.31.46.15", "172.31.47.43"]
cluster.initial_master_nodes: ["172.31.46.15"]
node.master: true
On the paris2 server replace this file /etc/elasticsearch/elasticsearch.yml with the contents shown below.
cluster.name: paris
node.name: paris2x
path.data: /var/lib/elasticsearch
path.logs: /var/log/elasticsearch
network.host: 172.31.47.43
discovery.seed_hosts: ["172.31.47.43","172.31.46.15"]
cluster.initial_master_nodes: ["172.31.46.15"]
Start ElasticSearch on each server:
sudo service elasticsearch start
Check the cluster status. You should see 2 nodes if everything is working.
curl -XGET http://172.31.46.15:9200/_cluster/health?pretty
{
"cluster_name" : "paris",
"status" : "green",
"timed_out" : false,
"number_of_nodes" : 2,
"number_of_data_nodes" : 2,
"active_primary_shards" : 2,
"active_shards" : 4,
"relocating_shards" : 0,
"initializing_shards" : 0,
"unassigned_shards" : 0,
"delayed_unassigned_shards" : 0,
"number_of_pending_tasks" : 0,
"number_of_in_flight_fetch" : 0,
"task_max_waiting_in_queue_millis" : 0,
"active_shards_percent_as_number" : 100.0
}
Configure Kibana
Replace the config file /etc/kibana/kibana.yml with this:
server.host: "172.31.46.15"
server.name: "paris"
elasticsearch.hosts: ["http://172.31.46.15:9200"]
elasticsearch.preserveHost: false
logging.dest: stdout
logging.verbose: true
Start Kibana. It might take a minute or longer to start.
sudo service kibana start
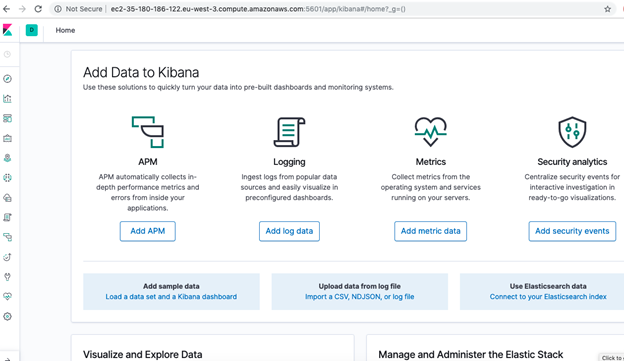
Open the Kibana Console
http://ec2-35-180-186-122.eu-west-3.compute.amazonaws.com:5601/app/kibana
It might take a few minutes to download the graphics and to start Kibana as well. The dashboard will appear:

Troubleshooting
- If either node cannot join the cluster then erase the /var/lib/elasticsearch folder as the cluster UUIDs probably don’t match. This will happen if you make mistakes and restart the servers with different settings.
curl http://172.31.47.43:9200 { "name" : "paris2x", "cluster_name" : "paris", "cluster_uuid" : "uB_1NLmYRbKcVbKGPzsNSQ", "version" : { "number" : "7.0.1", "build_flavor" : "default", "build_type" : "deb", "build_hash" : "e4efcb5", "build_date" : "2019-04-29T12:56:03.145736Z", "build_snapshot" : false, "lucene_version" : "8.0.0", "minimum_wire_compatibility_version" : "6.7.0", "minimum_index_compatibility_version" : "6.0.0-beta1" }, "tagline" : "You Know, for Search" } - Make sure port 5601 is open in the outbound direction. In Europe, because of the GDPR requirements, companies have stopped opening all ports in the outbound direction by default.
- If you want to run either ElasticSearch or Kibana in the foreground you can do that. This is only for troubleshooting purposes. The Kibana configuration above is set to log output to stdout so you would have to run it in the foreground to see that or set the logs to write to disk. You can run Kibana as root. But you cannot run ElasticSearch as root. So you would have to change the ownership of /usr/share/elasticsearch, /var/log/elasticsearch, and /var/lib/elasticsearch to your userid or login as user elasticsearch to run elasticsearch in the foreground. You will find both binaries in /usr/share/kibana and /usr/share/elasticsearch folders.
- Look for ElasticSearch errors in /var/log/elasticsearch/paris.log. The file name is the node name.
Next Steps
The next steps before going to production would be to increase the memory size to ½ of the memory of the machine (recommended by ElasticSearch) in /etc/elasticsearch/jvm.options by changing the values below.
-Xms1g
-Xmx1g
You would also want to put a proxy server in front of this so that you can configure basic authentication and ssh. (You can configure ssh in ElasticSearch as well.)


