Here we explain how to send logs to ElasticSearch using Beats (aka File Beats) and Logstash. We will parse nginx web server logs, as it’s one of the easiest use cases. We also use Elastic Cloud instead of our own local installation of ElasticSearch. But the instructions for a stand-alone installation are the same, except you don’t need to user a userid and password with a stand-alone installation, in most cases.
We previously wrote about how to do parse nginx logs using Beats by itself without Logstash. You might wonder why you need both. The answer it Beats will convert the logs to JSON, the format required by ElasticSearch, but it will not parse GET or POST message field to the web server to pull out the URL, operation, location, etc. With logstash you can do all of that.
So in this example:
- Beats is configured to watch for new log entries written to /var/logs/nginx*.logs.
- Logstash is configured to listen to Beat and parse those logs and then send them to ElasticSearch.
Download and install Beats:
wget https://artifacts.elastic.co/downloads/beats/filebeat/filebeat-7.1.1-amd64.deb
sudo dpkg -i filebeat-7.1.1-amd64.deb
You don’t need to enable the nginx Beats module as we will let logstash to do the parsing.
Edit the /etc/filebeat/filebeat config file:
You want to change is the top and bottom sections of the file. Below we show that in two separate sections. First the top:
The important items are:
| enabled: true | Otherwise it will do nothing. |
| – /var/log/nginx/*.log | You can list which folders to watch here. Put each one a line by itself. In this case we only list nginx. |
#=========================== Filebeat inputs =============================
filebeat.inputs:
# Each - is an input. Most options can be set at the input level, so
# you can use different inputs for various configurations.
# Below are the input specific configurations.
- type: log
# Change to true to enable this input configuration.
enabled: true
# Paths that should be crawled and fetched. Glob based paths.
paths:
- /var/log/nginx/*.log
Here you want to:
- Rem out the ElasticSearch output we will use logstash to write there.
- Unrem the Logstash lines.
- Tell Beats where to find LogStash.
- Make sure you rem out the line ##output.elasticsearch too.
#-------------------------- Elasticsearch output ------------------------------
##output.elasticsearch:
# Array of hosts to connect to.
# hosts: ["localhost:9200"]
# Enabled ilm (beta) to use index lifecycle management instead daily indices.
#ilm.enabled: false
# Optional protocol and basic auth credentials.
#protocol: "https"
#username: "elastic"
#password: "changeme"
#----------------------------- Logstash output --------------------------------
output.logstash:
# The Logstash hosts
hosts: ["localhost:5044"]
Now start Beats. The -e tells it to write logs to stdout, so you can see it working and check for errors.
sudo /usr/share/filebeat/bin/filebeat -e -c /etc/filebeat/filebeat.yml
Install LogStash
cd /usr/share
sudo mkdir logstash
sudo wget https://artifacts.elastic.co/downloads/logstash/logstash-7.1.1.tar.gz
sudo tar xvfz logstash-7.1.1.tar.gz
Now edit /usr/share/logstash/logstash-7.1.1/config/nginx.conf
The items to note are:
| input | tell logstash to listen to Beats on port 5044 |
| filter { grok { | In order to understand this you would have to understand Grok. Don’t try that yet. It’s a file parser tool. It basically understands different file formats, plus it can be extended. Use the example below as even the examples in the ElasticSearch documentation don’t work. Instead tech writers all use the same working example. |
| output { elasticsearch { hosts => [“https://58571402f5464923883e7be42a037917.eu-central-1.aws.cloud.es.io:9243”] user => “elastic” password => “xxxxxxxx” index => “logstash-%{+YYYY.MM.dd}” } stdout { codec => rubydebug } } | This part is disappointing at ElasticSearch does not let you use the cloud.id and cloud.auth to connect to ElasticSearch, as does Beats. So you have to give it the URL and the userid and password. Use the same userid and password that you log into cloud.elastic.com with. You could also create another user, but then you would have to give that user the authority to create indices. So using the elastic user is using the super user as a short log. The index line lets you make the index a combination of the words logstash and the date. The goal is to give it some meaningful name. Perhaps nginx* would be better as you use Logstash to work with all kinds of logs and applications. codec = rubydebug writes the output to stdout so that you can see that is it working. |
input {
beats {
port => 5044
host => "0.0.0.0"
}
}
filter {
grok {
match => [ "message" , "%{COMBINEDAPACHELOG}+%{GREEDYDATA:extra_fields}"]
overwrite => [ "message" ]
}
mutate {
convert => ["response", "integer"]
convert => ["bytes", "integer"]
convert => ["responsetime", "float"]
}
geoip {
source => "clientip"
target => "geoip"
add_tag => [ "nginx-geoip" ]
}
date {
match => [ "timestamp" , "dd/MMM/YYYY:HH:mm:ss Z" ]
remove_field => [ "timestamp" ]
}
useragent {
source => "agent"
}
}
output {
elasticsearch {
hosts => ["https://58571402f5464923883e7be42a037917.eu-central-1.aws.cloud.es.io:9243"]
user => "elastic"
password => "xxxxxxxx"
index => "logstash-%{+YYYY.MM.dd}"
}
stdout { codec => rubydebug }
}
Now start Logstash in the foreground so that you can see what is going on.
sudo /usr/share/logstash/logstash-7.1.1/bin/logstash -f /usr/share/logstash/logstash-7.1.1/config/nginx.conf
Assuming you have some the nginx web server and some logs being written to /var/log/nginx after a minute or so it should start writing logs to ElasticSearch. Or you can download https://raw.githubusercontent.com/respondcreate/nginx-access-log-frequency/master/example-access.log to give it some sample entries.
Export your password and ElasticSearch userid into the environment variable:
export pwd="elastic:xxxxx"
Then query ElasticSearch and you should see the logstash* index has been created.
curl --user $pwd -XGET https://58571402f5464923883e7be42a037917.eu-central-1.aws.cloud.es.io:9243/logstash-2019.06.19-000001/_search?pretty
Now you can query that ElasticSearch index and look at one record. Below we have shortened the record so that you can see that it has parsed the message log entry into individual fields, which you could then query, like request (the URL) and verb (GET, PUT, etc.).
curl --user $pwd -X GET 'https://58571402f5464923883e7be42a037917.eu-central-1.aws.cloud.es.io:9243/logstash-2019.06.19-000001?pretty'
{
"_index" : "logstash-2019.06.19-000001",
"_type" : "_doc",
"_id" : "9RZDcWsBDzKZEQI4C4Qu",
…
"verb" : "GET",
"input" : {
"type" : "log"
},
"auth" : "-",
"source" : "/var/log/nginx/another.log",
"device" : "Other",
….
"geoip" : {
"timezone" : "Europe/Moscow",
"latitude" : 55.7386,
"location" : {
"lon" : 37.6068,
"lat" : 55.7386
},
"longitude" : 37.6068,
"country_code2" : "RU",
"ip" : "46.160.190.178",
"continent_code" : "EU",
"country_code3" : "RU",
"country_name" : "Russia"
},
…
"response" : 200,
"os_name" : "Windows",
"major" : "52",
"agent" : "\"Mozilla/5.0 (Windows NT 10.0; WOW64) AppleWebKit/537.36 (KHTML, like Gecko) Chrome/52.0.2743.116 Safari/537.36\"",
"build" : "",
"clientip" : "46.160.190.178",
"@version" : "1",
"message" : "46.160.190.178 - - [19/Jun/2019:12:39:52 +0000] \"GET / HTTP/1.1\" 200 481 \"-\" \"Mozilla/5.0 (Windows NT 10.0; WOW64) AppleWebKit/537.36 (KHTML, like Gecko) Chrome/52.0.2743.116 Safari/537.36\"",
…
"request" : "/",
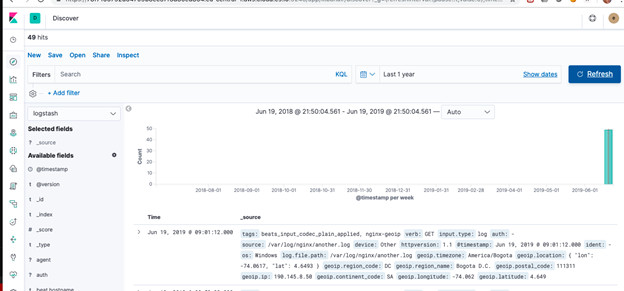
In Kibana it will look like this:

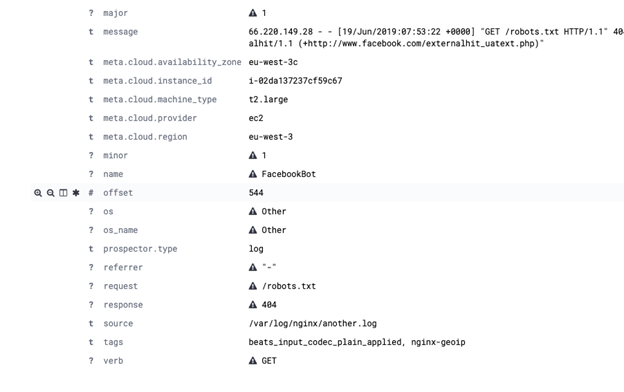
And like this when expanded:


