Here we show how to load CSV data into ElasticSearch using Logstash.
The file we use is network traffic. There are no heading fields, so we will add them.
Download and Unzip the Data
Download this file eecs498.zip from Kaggle. Then unzip it. The resulting file is conn250K.csv. It has 256,670 records.
Next, change permissions on the file, since the permissions are set to no permissions.
chmod 777 conn250K.csv
Now, create this logstash file csv.config, changing the path and server name to match your environment.
input {
file {
path => "/home/ubuntu/Documents/esearch/conn250K.csv"
start_position => "beginning"
}
}
filter {
csv {
columns => [ "record_id", "duration", "src_bytes", "dest_bytes" ]
}
}
output {
elasticsearch {
hosts => ["parisx:9200"]
index => "network"
}
}
Then start logstash giving that config file name.
sudo bin/logstash -f config/csv.conf
While the load is running, you can list some documents:
curl XGET http://parisx:9200/network/_search?pretty
results in:
"_index" : "network",
"_type" : "_doc",
"_id" : "dmx9emwB7Q7sfK_2g0Zo",
"_score" : 1.0,
"_source" : {
"record_id" : "72552",
"duration" : "0",
"src_bytes" : "297",
"host" : "paris",
"message" : "72552,0,297,9317",
"@version" : "1",
"@timestamp" : "2019-08-10T07:45:41.642Z",
"dest_bytes" : "9317",
"path" : "/home/ubuntu/Documents/esearch/conn250K.csv"
}
You can run this query to follow when the data load is complete, which is when the document count is 256,670.
curl XGET http://parisx:9200/_cat/indices?v
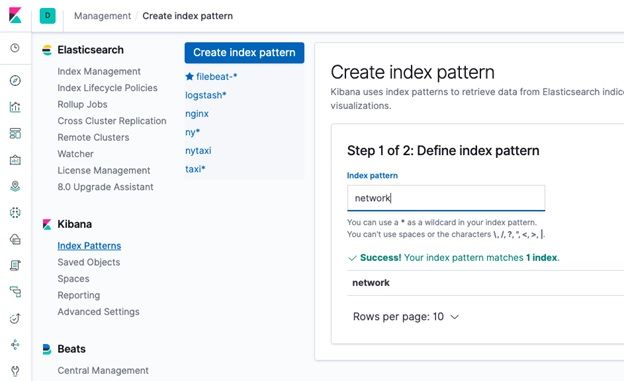
Create Index Pattern in Kibana
Open Kibana.

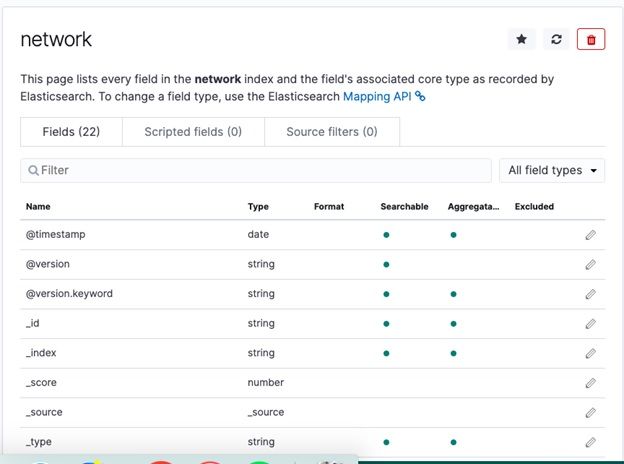
Create the Index Pattern. Don’t use @timestamp as a key field as that only refers to the time we loaded the data into Logstash. Unfortunately, the data provided by Kaggle does not include any date, which is strange for network data. But we can use the record_id in later time series analysis.

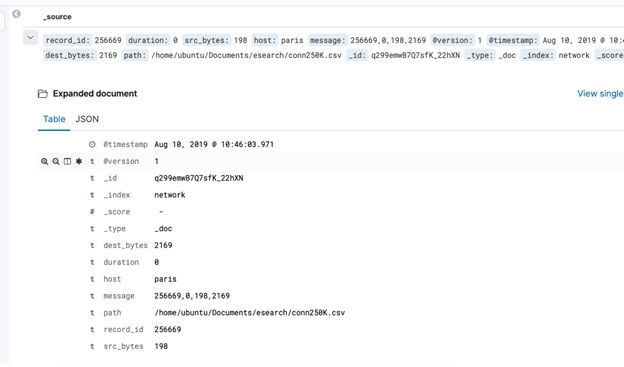
Now go to the Discover tab and list some documents:

In the next blog post we will show how to use Elasticsearch Machine Learning to do Anomaly Detection on this network traffic.


