This is the fourth post in our series on Tableau. For the next few blog posts, I’m going to illustrate certain Tableau concepts. For the data, I’m using stock price, earnings, and dividend information from Disney, Starbucks, and Johnson & Johnson.
In this article, I will illustrate how to join tables, use right and left joins, reverse mistakes, and use statistical functions to find correlation between variables. We’ll use these functions and analytics to answer these questions:
- To what extent do stock prices reflect cash flow and earnings?
- Are dividends related to cash flow or earnings?
Setting up Tableau
If you’re new to Tableau, you can see our previous articles that help you get started with basic datasets and examples. Previous articles include:
- Tableau: Getting Started with Real Examples
- Using Tableau with PostgreSQL
- How To Make an Expense Report in Tableau Online
Download the data
To start, you’ll need data. To get the data I use, simply do what I did: download from Stockpup and Yahoo Finance and clean it up a little. The earnings data for all three companies is from 1999. Stock prices and dividends are from 2010 to 2018.
Download the data here. Next, store the companies’ earnings, dividends, and stock data in any database you like, as long as it is supported by PostgreSQL. (We use PostgreSQL.)
Creating tables for Tableau
Here are the steps for creating your tables of data:
- Use the below commands to create the tables.
- Upload your tables to PostgreSQL.
- Connect those data sources to Tableau using the procedure we previously outlined.
create table earnings (
Symbol VARCHAR(50),
Quarterend date,
Shares bigint,
Sharessplitadjusted bigint,
Splitfactor bigint,
Assets bigint,
CurrentAssets bigint,
Liabilities bigint,
CurrentLiabilities bigint,
Shareholdersequity bigint,
Noncontrollinginterest bigint,
Preferredequity bigint,
Goodwillintangibles bigint,
Longtermdebt bigint,
Revenue bigint,
Earnings bigint,
Earningsavailableforcommonstockholders bigint,
EPSbasic float,
EPSdiluted float,
Dividendpershare float,
Cashfromoperatingactivities bigint,
Cashfrominvestingactivities bigint,
Cashfromfinancingactivities bigint,
Cashchangeduringperiod bigint,
Cashatendofperiod bigint,
Capitalexpenditures bigint,
Price float,
Pricehigh float,
Pricelow float,
ROE float,
ROA float,
Bookvalueofequitypershare float,
PBratio float,
PEratio float,
Cumulativedividendspershare float,
Dividendpayoutratio float,
Longtermdebttoequityratio float,
Equitytoassetsratio float,
Netmargin float,
Assetturnover float,
Freecashflowpershare float,
Currentratio float
);
create table dividends (Date date,
Dividends float,
Symbol VARCHAR(50));
create table prices ( Date date,Open float,High float,Low float ,Close float,AdjClose float ,Volume bigint ,symbol varchar(50));
Load the data into PostgreSQL using the steps below. You must be the admin user to copy these files to these tables.
COPY earnings FROM '/home/ubuntu/Documents/tableau/dis.dividends.csv' DELIMITER ',' CSV HEADER;
COPY earnings FROM '/home/ubuntu/Documents/tableau/sbux.dividends.csv' DELIMITER ',' CSV HEADER;
COPY earnings FROM '/home/ubuntu/Documents/tableau/jns.dividends.csv' DELIMITER ',' CSV HEADER;
COPY dividends FROM '/home/ubuntu/Documents/tableau/sbux.dividends.csv' DELIMITER ',' CSV HEADER;
COPY dividends FROM '/home/ubuntu/Documents/tableau/jnj.dividends.csv' DELIMITER ',' CSV HEADER;
COPY dividends FROM '/home/ubuntu/Documents/tableau/dis.dividends.csv' DELIMITER ',' CSV HEADER;
COPY prices FROM '/home/ubuntu/Documents/tableau/sbux.prices.csv' DELIMITER ',' CSV HEADER;
COPY prices FROM '/home/ubuntu/Documents/tableau/jns.prices.csv' DELIMITER ',' CSV HEADER;
COPY prices FROM '/home/ubuntu/Documents/tableau/dis.prices.csv' DELIMITER ',' CSV HEADER;
How to join tables (right and left joins)
The common element among all these tables in the stock symbol. Tableau will automatically try to join the three tables—dividends, earnings, and prices—by the stock symbol. But we can’t allow this auto-join because the tables have different numbers of records. This is because Disney did not pay dividends in all 40 quarters, though Johnson & Johnson and Starbucks did. (Doing this, an inner join, in this case would drop some rows of data.)
So, you must do right or left joins, depending on what data you’re investigating. For our purpose, looking at earnings and dividends, we need to do a right join because there are more earnings than dividends.
To change the join type, double-click the double circles in Tableau Online.

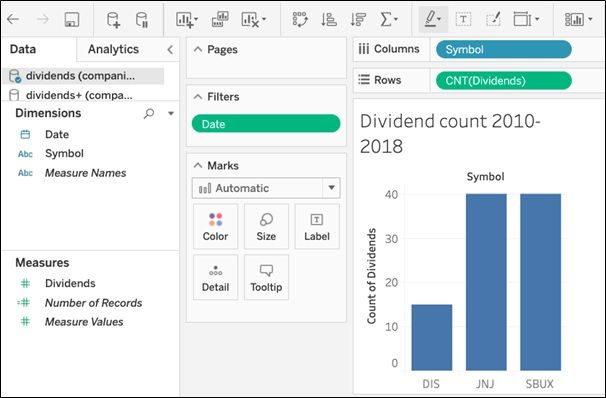
This worksheet shows that Disney paid dividends only 15 out of 40 quarters. This is a bar chart of the stock symbol and cnt(Dividends), meaning dividend count.
As you work with worksheets, type over the name at the bottom and give them a descriptive name.
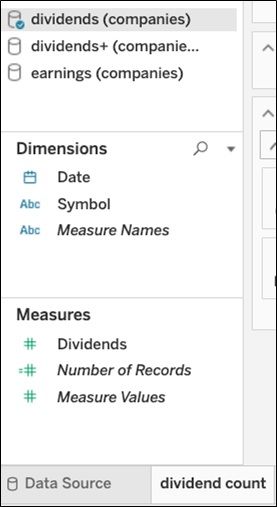
In the above worksheet, the plus (+) sign indicates that the two tables are joined. Notice that it shows the 3 tables as well as the joins you have defined in the data sources. Be careful to pick the correct table or relation when you make a chart.
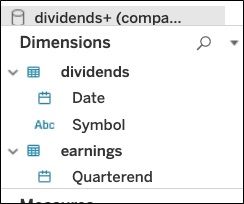
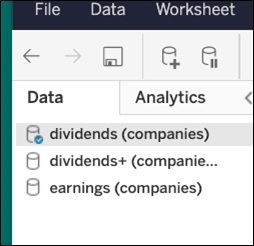
Below, when you select dividends+ it lists fields from both tables on the left. These are the fields you can use in the worksheet:
How to reverse errors
If you mess up, you can simply reverse: click the left-hand arrow at the top to go back.
Earnings analysis
Let’s look at earnings. On the left, select the earnings table.
If you’ve read financial statements before, you know that they are shown in the thousands. So, create a calculated field earnings1000 to divide this large number by 1,000 to make it easier to see. We make this a calculated field.
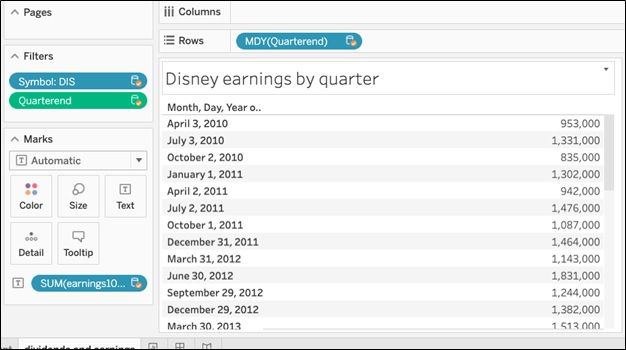
Analysis: Disney earnings by quarter
We put the quarter filing date in the rows and the value we want to list in Marks section. This sums earnings per quarter, which is the same as listing the single value of earnings, since there is only one record per filing period.
Then, filter on the stock simple. We also filter on the Quarterend to pick only dates from 2010 to 2018, since that is the dates for which we have dividends and stock prices.
Now, using Disney, Starbucks, J&J, or your own company’s data, you can begin your analysis.


