IT infrastructure that powers the modern enterprise can take a range of complex architectural form-factors: virtualized, software-defined, hybrid and multi-cloud, on-premise and off-site data center deployments. It’s important to keep an eye on how well the infrastructure performs, since every second of IT downtime or performance lapse can cost businesses millions of dollars in revenue opportunities.
This makes IT monitoring a valuable practice—and worth a deeper look. In this article, we’ll explore the broad concept of IT monitoring, covering both the business and technical aspects of network performance.
What is IT monitoring?
The purpose of IT monitoring is to determine how well your IT infrastructure and the underlying components perform in real time. IT monitoring lets users identify IT issues in real-time in order to make well-informed decisions for resource provisioning, IT security, or to evaluate usage trends.
IT monitoring technologies often have three major components:
- Sensors that generate raw data from network nodes
- Analytics solutions that process this data into information
- UI interfaces that visualize intuitive and insightful reports
IT monitoring overlaps a broad range of disciplines focused on tracking specific aspects of IT network security and performance, including
- IT Operations Management (ITOM)
- Security Information and Event Management (SIEM)
- Security Orchestration, Automation, and Response (SOAR)
- Operational Intelligence (OI)
Types of IT monitoring
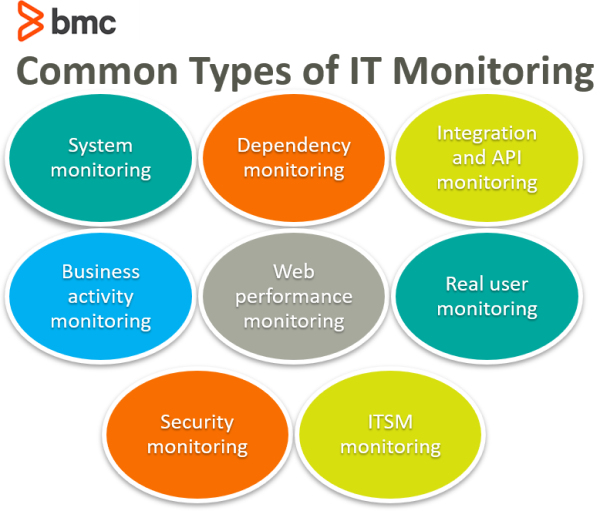
Different types of IT monitoring and can be used strategically to gain maximum visibility into the IT and business performance. IT monitoring types can encompass many functions of the IT organization.
Excluded from the list below is the monitoring of IT metrics associated with customer experience and IT service management (ITSM). IT monitoring offers a broad scope in the domain of ITSM and Service Desk use cases, where a diverse range of metrics and KPIs can be monitored to evaluate the ITSM and Service Desk performance.
Here are some common types of IT monitoring:

System monitoring
System monitoring evaluates the performance of infrastructure components at the physical layer of the network:
- Each server is monitored individually and the collective information from network nodes is further analyzed to evaluate the impact on network performance.
- Issues with hardware components are identified and addressed accordingly.
System monitoring is also referred to as availability monitoring, dealing with metrics such as server uptime and CPU performance.
Dependency monitoring
Applications running over distributed IT infrastructure can be dependent on a variety of network nodes, other application components, and services. These dependencies are mapped by evaluating the incoming network connections. The resource consumption at specific nodes can determine how internal server components react to an application performance and its inbound data traffic. This information helps identify the underlying architectural dependencies between apps, hardware, and services.
Integration and API monitoring
Modern apps and services rely on external integrations for data processing, resource capacity, and other functional processes. Integration monitoring is used to identify the availability and uptime performance of third-party integrations.
Business Activity Monitoring (BAM)
Business activity is highly correlated with IT infrastructure and network performance. IT monitoring that evaluates resource consumption and traffic behavior helps businesses determine the corresponding business activities. For example, user traffic and application downloads from specific network nodes and data centers suggests high popularity in that geographic location.
Appropriate metrics can be defined to extract insights on the financial, security, operational, and technology performance of the business with the help of IT monitoring.
Web performance monitoring
This monitoring evaluates the moving parts of your web-based service, such as websites, specifically how the service responds to a user-request at the client-side of the network. Measurements include page load speed, data transmission errors, loading errors, and more.
According to research, it takes Internet users 50 milliseconds (0.05 seconds) to make a decision on using a website. When a page load takes too long, users are quick to switch to a competing web service that offers faster performance.
Application Performance Monitoring (APM)
Applications are very much part of the modern business. APM observes how well the apps behave in the current state of the IT environment. The scope of monitoring is extended to the underlying infrastructure components and dependencies. APM aggregates and analyzes inbound network data to evaluate the state of the IT environment and identify the problem root cause when apps perform suboptimally.
APM metrics include:
- Resource consumption
- Error rates at the software level
- App response times and request rates
- Customer experience
Real User Monitoring (RUM)
Applications behave in the real world differently from the tightly controlled test simulations environment. Testing apps for real-world usage provides an accurate perspective on how users perceived and responded to the application or service performance. For example, the number of users staying on a website for more than a few seconds after hitting the link suggests how many were satisfied with the page load speed and decided to stay. RUM is designed to record such interactions and provide the historical performance of a service delivered to end-users over the network.
Security monitoring
Security attacks and network infringements impact the flow of data traffic and network behavior. Unusual activities can be tracked against defined policies of information access and authorization. Using advanced AI-based solutions, the monitored network log data can be analyzed for anomalous behavior before the potential threats can impact the business.
IT monitoring in modern SDLC frameworks
In engineering-focused domains, IT monitoring plays a key role in enabling modern Software Development Lifecycle (SDLC) frameworks such as DevOps. The role of IT monitoring is focused on the performance of collaborating teams within Development, Operations and QA departments.
For example, API monitoring is a key component to evaluate the behavior of third-party integrations. When new features are released to production environments at the rapid pace of DevOps, System Monitoring and APM have a key role in identifying potential bugs or glitches that may have gone unnoticed.
Additional resources
For more information on IT monitoring, visit these BMC Blogs:
- Tracing vs Logging vs Monitoring: What’s the Difference?
- Infrastructure Monitoring vs Management: What’s The Difference
- MTBF vs. MTTF vs. MTTR: Defining IT Failure
- Why Application Monitoring Is Critical to Multi-Cloud Success
- Why Application-Centric Infrastructure Requires A Different Approach to APM
- Discovery and Dependency Mapping in the Information Age


